Create pie or donut charts while retaining ggplot flexibility, such as leveraging faceting and palettes, and fine-tuning appearance
The function
geom_donut_int()creates visually internal donut layer as aggregation of passed valuesThe function
geom_donut_ext()creates visually external donut layer of passed valuesgeom_donut_int0()andgeom_donut_ext()are generic geoms not supporting highlight feature
Usage
geom_donut_int0(
  mapping = NULL,
  data = NULL,
  stat = "donut_int",
  position = "identity",
  na.rm = FALSE,
  show.legend = NA,
  inherit.aes = TRUE,
  r_int = 0,
  r_ext = 1,
  hl_shift = 0.1,
  ...
)

geom_donut_int(..., hl_col = "firebrick")

geom_donut_ext0(
  mapping = NULL,
  data = NULL,
  stat = "donut_ext",
  position = "identity",
  na.rm = FALSE,
  show.legend = NA,
  inherit.aes = TRUE,
  r_int = 1.5,
  r_ext = 2,
  hl_shift = 0.1,
  ...
)

geom_donut_ext(..., hl_col = "firebrick")
Format
An object of class StatDonutInt (inherits from Stat, ggproto, gg) of length 4.
An object of class StatDonutIntHl (inherits from Stat, ggproto, gg) of length 4.
An object of class StatDonutExt (inherits from Stat, ggproto, gg) of length 4.
An object of class StatDonutExtHl (inherits from Stat, ggproto, gg) of length 4.
Arguments
- mapping
Set of aesthetic mappings created by
aes(). If specified andinherit.aes = TRUE(the default), it is combined with the default mapping at the top level of the plot. You must supplymappingif there is no plot mapping.- data
The data to be displayed in this layer. There are three options:
If
NULL, the default, the data is inherited from the plot data as specified in the call toggplot().A
data.frame, or other object, will override the plot data. All objects will be fortified to produce a data frame. Seefortify()for which variables will be created.A
functionwill be called with a single argument, the plot data. The return value must be adata.frame, and will be used as the layer data. Afunctioncan be created from aformula(e.g.~ head(.x, 10)).- stat
The statistical transformation to use on the data for this layer, either as a
ggprotoGeomsubclass or as a string naming the stat stripped of thestat_prefix (e.g."count"rather than"stat_count")- position
Position adjustment, either as a string naming the adjustment (e.g.
"jitter"to useposition_jitter), or the result of a call to a position adjustment function. Use the latter if you need to change the settings of the adjustment.- na.rm
If
FALSE, the default, missing values are removed with a warning. IfTRUE, missing values are silently removed.- show.legend
logical. Should this layer be included in the legends?
NA, the default, includes if any aesthetics are mapped.FALSEnever includes, andTRUEalways includes. It can also be a named logical vector to finely select the aesthetics to display.- inherit.aes
If
FALSE, overrides the default aesthetics, rather than combining with them. This is most useful for helper functions that define both data and aesthetics and shouldn't inherit behaviour from the default plot specification, e.g.borders().- r_int
Internal donut radius
- r_ext
External pie or donut radius
- hl_shift
Sets the spacing to show highlighted segments
- ...
Other arguments passed on to
layer(). These are often aesthetics, used to set an aesthetic to a fixed value, likecolour = "red"orsize = 3. They may also be parameters to the paired geom/stat.- hl_col
Sets the color for highlighted segments. It's possible to use both simultaneously
hl_coland genericcolour
Details
There are two additional aesthetics possible to use:
highlight- optional aesthetic which expects logical (TRUE/FALSE) variable in order to highlight particular donut segmentsopacity- operates pretty much the same asalphabut ensure more contrast colors and removes legend. Oncealphais setopacitydoes not affect a chart
Examples
# Create an example
set.seed(1605)
n <- 20
df <- dplyr::tibble(
  lvl1 = sample(LETTERS[1:5], n, TRUE),
  lvl2 = sample(LETTERS[6:24], n, TRUE),
  value = sample(1:20, n, TRUE),
  highlight_ext = sample(c(FALSE,TRUE), n, TRUE, c(.7, .3))) |>
  dplyr::mutate(highlight_int = ifelse(lvl1 == "A", TRUE, FALSE))

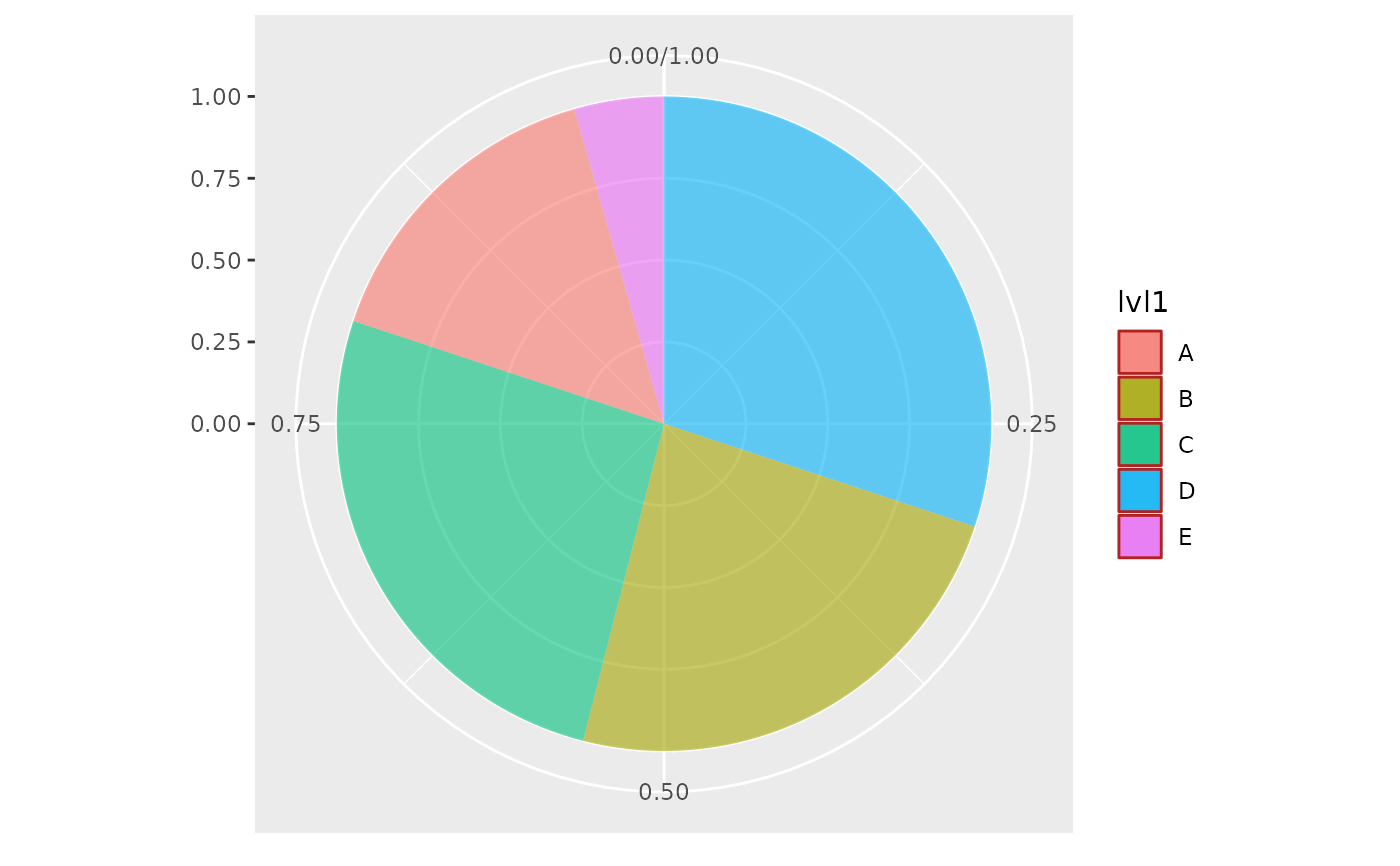
# Create a simple pie chart
ggplot(df, aes(value = value, fill=lvl1)) +
  geom_donut_int(alpha=.6) +
  coord_polar(theta = "y")


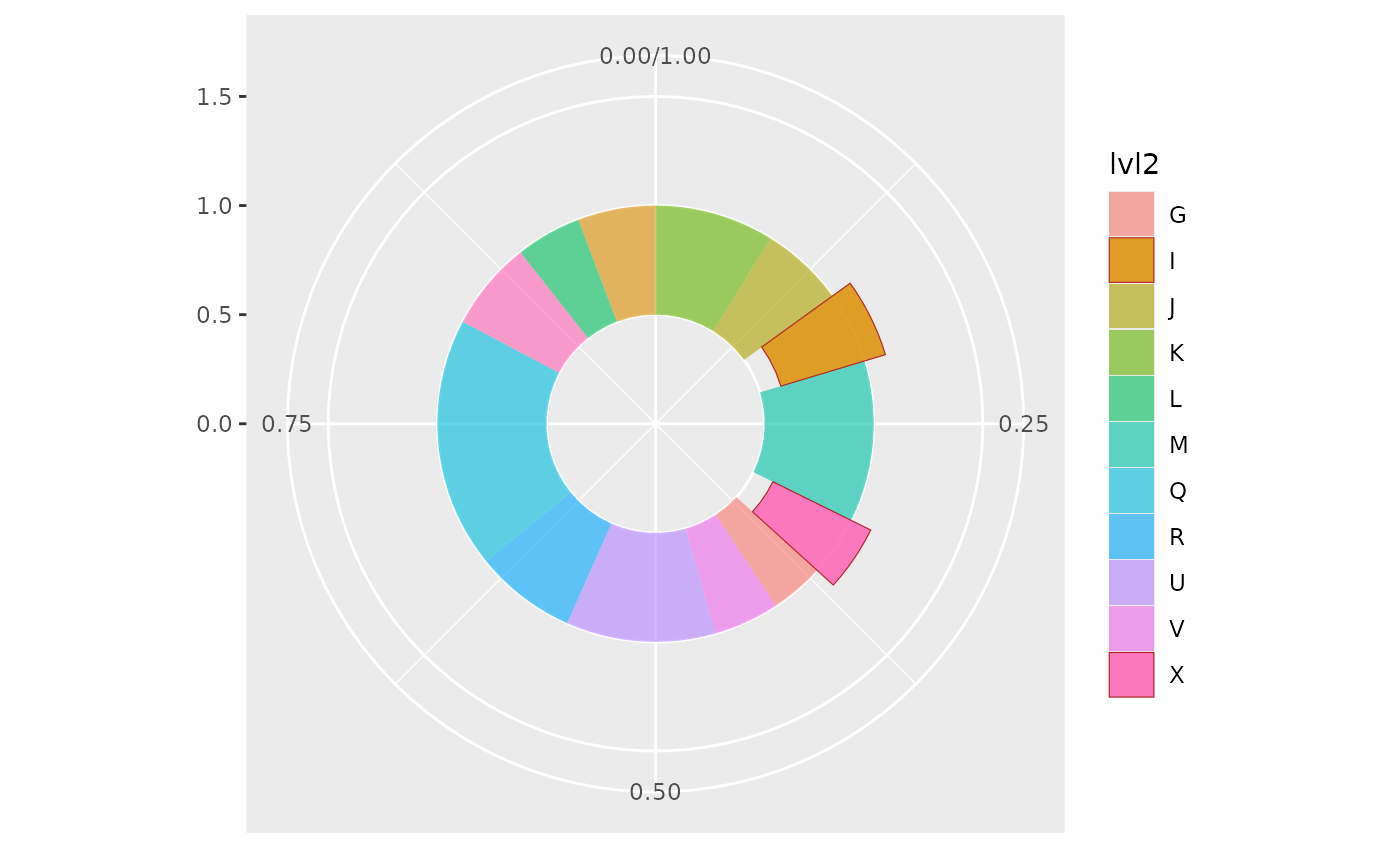
# Create a simple donut chart that can handle more granular data
# and highlight specific segments
ggplot(df, aes(value = value, fill=lvl2, highlight=highlight_ext)) +
  geom_donut_int(r_int=.5, alpha=.6, linewidth=.2) +
  coord_polar(theta = "y") +
  xlim(0, 1.5)


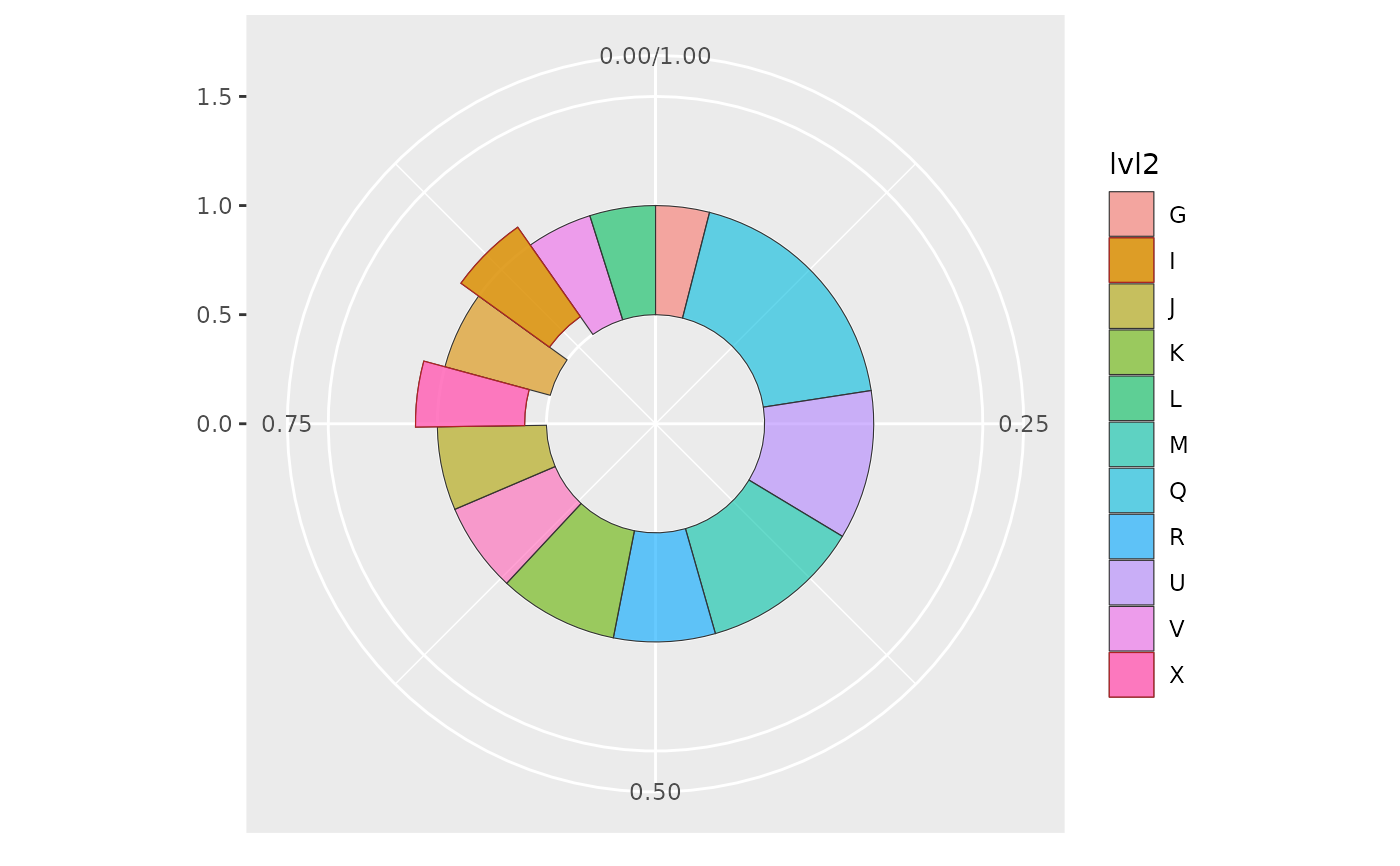
# Perform data preparation tasks with `packing()`
# and apply specific color
packing(df, value) |>
  ggplot(aes(value = value, fill=lvl2, highlight=highlight_ext)) +
  geom_donut_int(r_int=.5, alpha=.6, linewidth=.2, col = "gray20") +
  coord_polar(theta = "y") +
  xlim(0, 1.5)


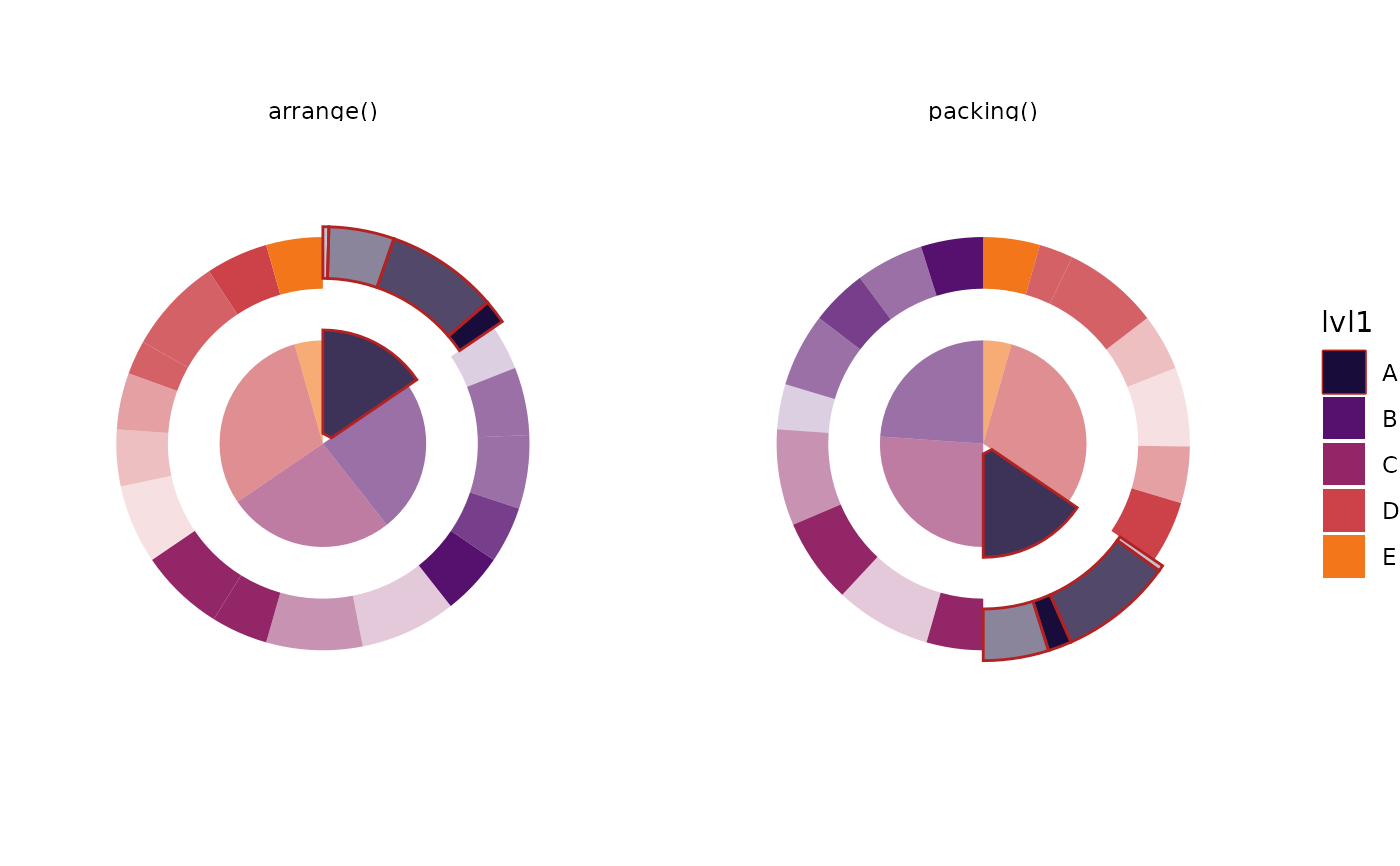
# Built combined donut chart with interanl and external layers
dplyr::bind_rows(
# arrange by value
`arrange()` = dplyr::arrange(df, lvl1, lvl2, value),
# pack values for better space management
`packing()` = packing(df, value, lvl1),
.id = "prep_type") |>
 ggplot(aes(value = value, fill=lvl1)) +
 geom_donut_int(aes(highlight=highlight_int), alpha=.6) +
 geom_donut_ext(aes(opacity=lvl2, highlight=highlight_int)) +
 # apply facets
 facet_grid(~prep_type) +
 # style chart with palette and theme
 scale_fill_viridis_d(option = "inferno", begin = .1, end = .7) +
 theme_void() +
 coord_polar(theta = "y") +
 xlim(0, 2.5)

